Archive

Archive for the ‘Trading’ Category

BroadVision’s Dead Pump Bounce

September 26th, 2012 No comments

BroadVision Inc (NASDAQ:BVSN) was up earlier this year due to a pump and dump scam successful investor relations campaign. Just as with market bubbles, if the fundamentals of a company are weak, what goes up must eventually come down. ‘Eventually’ being the operative word. When BVSN broke out above $10 back in mid-December, nobody knew it would eventually make a high of $56.46, showing once again that prices can rise the most in exactly the places where fundamentals are weakest.

Last Wednesday, out of the blue, BVSN down far off its highs to the mid-$8 level ran big (1), to the upper $11, to close that day in the high $10’s. The next day, it peaked at $11.96 only to fall sharply in the afternoon going red on the day (2). Taking this as a sign of weakness, I entered into a short position, but the stock managed to come back some and close slightly positive at $11. I could see the next morning it wasn’t quite ready to break down, so I covered for a loss (3) avoiding the potential for further losses as the stock ran back up to $11.50.

1) Run-up, 2) Sign of weakness, 3) Not breaking down, 4) Fading, no shares, 5) Fading, found shares, 6) Covered

There was clear fading in the afternoon, and so I tried to re-short (4), but no shares were available through my broker, so I had to just sit on my hands. Monday started low but spiked real fast in the morning. By afternoon, it was clear that both the volume was fading and the price was falling, a great indicator of an upcoming drop (5). Luckily, my broker did have shares this time, so I shorted again, an even larger position since everything was in my favor: stock was red on the day, close to making a new day’s low, fading volume, and coming off of a spike.

Today, I covered my position (6) even though it’s likely the stock had another dollar to drop. My reasons for playing it safe are as follows: First, stormy weather was causing problems with my internet connection, and this was affecting my trading platform. Second, I rarely like holding for more than 2 days. Third, a lot of traders don’t like the risks involved in holding a short position over the weekend, so Friday squeezes are common, and sometimes it even happens on a Thursday. The later in the week I hold, the more probable a price spike becomes. And fourth, given the trading history of BVSN, after 4 red days, a green day is due.

Aside from the price action, what’s worth mentioning is how I traded. I made two trades on this. On one I lost money, on the other I made money. You might be tempted to say that’s 50/50, no better odds than tossing a coin. But on net between these two trades, I’m up about $300 on a $3500ish investment, for a roughly 8.5% gain in less than one week. If only I could do that every week. 8.5% per week, compounded, would mean making 70 times my position (or close to a quarter million dollars) by year’s end!

So 50/50 really isn’t that bad if you can: Spot opportunities, Have a plan, Manage your risks, and Stay disciplined and humble. I believe technical analysis and the Austrian perspective will not only give you a better understanding of the markets in general, but make you better on those four specific points.

Categories: Trading Tags:

A Plan Can Make You Right, Even When You’re Wrong

September 21st, 2012 No comments

USEC Inc (NYSE:USU) turned out to be a great lesson today. I wrote intra-day about this stock and that I thought we were seeing signs of its momentum shifting, but it ended up making a comeback as the day went on, closing well in the green at 95 cents. Recall what I wrote earlier today,

If it breaks out above 85 cents, or at least proves to me it’s not breaking down any further, I would consider this a potential re-buy,

If you’d bought it the instant it broke out above 85 cents, you were up around 10% in less than 10 minutes. The important take-aways here are that these technical price levels do matter, that the aim is to react not predict, and a good plan can turn a losing prediction into a winning reaction.

USEC Inc goes red-to-green in the final minutes.

Categories: Trading Tags:

Rising Tides Lift More Than Just Boats

September 21st, 2012 No comments

After being up for 6 straight days, USEC Inc (NYSE:USU) has finally had a red day. Yesterday’s accelerated gains was actually an early warning sign, but often small market cap companies can have 2 or even 3 consecutive days of huge gains before falling apart. However, a red day is a sign of a shift in momentum. So far, the downward move has not yet erased Thursday’s big one-day gain, so it is possible the stock is just cooling off to go higher. But at this point, I am looking for the stock price to prove to me it can go higher before I jump in. If I had bought when I first alerted this stock at 54 cents, I would be selling now for a very handsome percent gain. If it breaks out above 85 cents, or at least proves to me it’s not breaking down any further, I would consider this a potential re-buy, but I have no interest in trying to guess the bottom to buy on the cheap.

Remember, Austrian economics teaches us we cannot know what future demand will be, and shares in a stock have a supply and demand just like any good traded on any market. We cannot predict, we can only prepare for likely scenarios and be ready to react.

Listeners of the Peter Schiff show may recall months ago when he warned of Jonathan Lebed and the National Inflation Association’s pump and dump scheme of BroadVision Inc (NASDAQ:BVSN). The NIA have long since stopped pumping this stock, and it’s been in free-fall ever since, but every now and then it has a big, multi-day run-up, and these run-ups provide technical opportunities for short-sellers.

There are two reasons why it is a good idea to consider short-selling BVSN. First, as most Austrians can probably appreciate, is the stock price is ultimately destined for de-valuation. Short-selling BVSN is making a trade in the directions of fundamentals, which will reward you in the long-term. The second reason is because BVSN is experiencing a technical event.

Unlike other aspects of technical analysis, which require a degree of subjectivity in guessing what key price levels are, technical events are more objectively grounded. The technical event we have here is a short-squeeze. A short-squeeze is basically when short-sellers are looking to close their positions, they must buy to cover. This buying, however, represents the closing of positions and is in no way indicative of speculators seeing future strength in the stock. The squeeze happens when the market somehow coordinates short-sellers into covering all around the same time. The sudden surge of buyers in a stock, especially a stock that is volatile, has a low float, and/or is trading in low volume, can send the price skyrocketing.

Regression to the mean is almost a gift from the market to short-sellers. However, sometimes the price surge can get the attention of real buyers and create some upward momentum. Sometimes this catches short-sellers off guard, and they have to cover and even higher prices still just to avoid being wiped out, so this move is not without its risks. In an ideal world, the safest way to play this is to wait for the first red day. The problem is in order to short sell, your broker needs to find you shares of the stock to borrow, and once momentum has shifted to the downside, those shares quickly become unavailable.

BVSN looked like it was finally ready to break down yesterday, so I entered a short position, mostly hoping for an early morning panic this morning. That didn’t happen, so I made sure to get out right away. Short-sellers generally don’t like holding over the weekend because there’s too much risk of positive news coming out during that time. This is the sort of thing that can coordinate covering and send the price higher. However, anyone who was going to cover before the close will be covered before the close, so if this stock spikes big at the end of the day, that spike may be the ideal time to short. It’s always nice holding an unrealized profit in a trade while awaiting the big move.

Categories: Markets, Trading Tags:

Trading Basics, Part I – Support & Resistance

September 4th, 2012 No comments

Critics of technical analysis is sometimes liken it to reading tea leaves, perhaps because it is partly subjective. There are a lot of different tools, but most traders pick and choose only a few to use. But the same could be said about running a business, and yet we can clearly see some individuals have consistently better track records than others for being profitable. The analogy is especially appropriate because successful traders tend to view trading as a business.

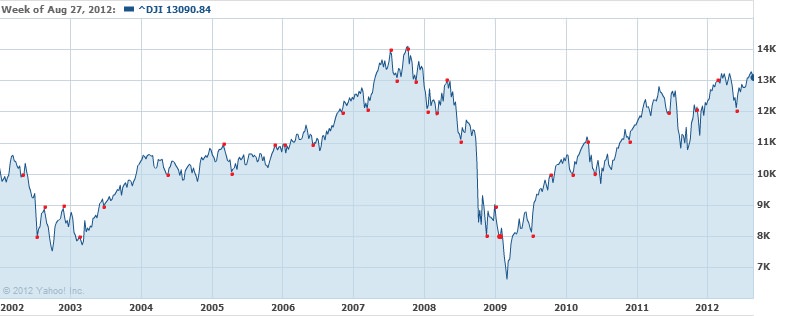
The most basic technical indicators are support and resistance levels. Support are relatively low price levels the stock has trouble falling below, and resistance is the relatively high price level the stock has trouble climbing above. If a stock is “range-bound”, trading within a tight price range, the high end of that range is the resistance and the low end is support. Other key price levels are where spikes or dips occur. It’s rare that these key levels are hit precisely, down to the penny, so some eye-balling is required, and some practice is required to select the most effective levels. The best price levels tend to be at round numbers.

Notice how often and spikes and dips turn around close to multiples of 1000 points.


When a stock price breaks out above a key resistance level, resistance often becomes support. And likewise when support is broken, it becomes resistance for the stock price thereafter. Moreover, when a stock price breaks through a support or resistance level, the stock price usually continues in that direction and changes at a faster rate. These technical moves provide an opportunity for traders to make quick profits.

From an Austrian perspective, there are real human action reasons why it works this way. The most common reason articulated is that of the “bag-holder”. This is someone who bought the stock at a higher price and held onto it despite it having gone down. When the stock moves to the top of its trading range, the bag-holder sees an opportunity to finally get out at a decent price. Another common reason has to do with belief. Traders may not believe the stock likely to break out above resistance, so when the price gets there, they take a short-position, betting on the stock price dropping. Speculators may also be trading within the range, buying at the low of the range and selling at the high.

For these various reasons, as the price reaches the resistance level, it brings in a disproportionate number of sellers, which of course will tend to push the price back down. However, if enough buyers take interest in a potential breakout, there are buyers for all the sellers. Once all the sellers have sold, the buyers push the stock price into a zone where there are relatively few sellers, and this allows the stock price to rise very quickly. This works for individual stocks as well as the overall market and creates difficulty for mathematical economic and financial models because breakouts stack the odds to make outliers more common than stochastic movements can account for.


Categories: Trading Tags: , , ,