Archive

Archive for September, 2012

Lots of Potential Tomorrow

September 27th, 2012 No comments

The S&P and Dow, both after breaking multi-year highs, have fallen back down to test that price level this week, and today’s price action seems to indicate support is holding. Gold and Silver continue to creep up to a key level. I’ve been waiting for gold to break $1800 simultaneous with silver above $35 as a buy signal, but often their breakouts begin early based on intra-day or intra-week technical levels. Tomorrow has better than even odds of being the day everything starts to move upwards again, but if prices aren’t moving, patience is key. Wait to see which key levels prices approach, and use gold and silver as confirmations on one another, and the Dow and S&P likewise.

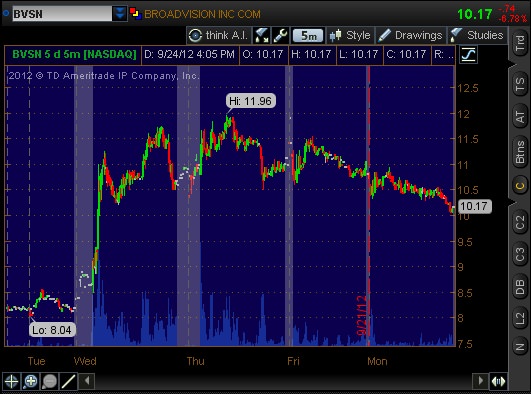
$BVSN spiked today like I feared, so I’m glad I covered yesterday, and this could create another great shorting opportunity.

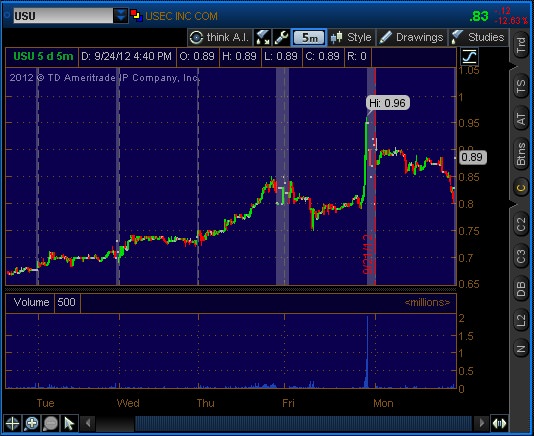
$USU right now looks like it’s going to take its time, so patience is key here. I exited my Puts because even though USU dropped from my entry point, it did not drop enough, and I risk losing time premium. Recall I thought 75 cents would be a key price level. All day yesterday, the stock traded within 4 cents of that level. Today it’s creeped up some, but there’s no clear breakout above the range and volume is lacking. Last week’s breakout over .85 if you look back in hindsight actually began to run at 82 cents. I would consider treating 82 cents as a key price level, but only if the volume picks up some or the direction is clear.

On the down side, I’d look at a fall below 70 cents as troublesome for this stock price, however the downside from there would be limited since the ran-up began from 50 cents. A total market breakout may be a catalyst for a USEC Inc breakout, but I’d rather be in Silver or Gold under that scenario. Up or down, this one will be on my back burner for now, but not forgotten.

Categories: Uncategorized Tags:

BroadVision’s Dead Pump Bounce

September 26th, 2012 No comments

BroadVision Inc (NASDAQ:BVSN) was up earlier this year due to a pump and dump scam successful investor relations campaign. Just as with market bubbles, if the fundamentals of a company are weak, what goes up must eventually come down. ‘Eventually’ being the operative word. When BVSN broke out above $10 back in mid-December, nobody knew it would eventually make a high of $56.46, showing once again that prices can rise the most in exactly the places where fundamentals are weakest.

Last Wednesday, out of the blue, BVSN down far off its highs to the mid-$8 level ran big (1), to the upper $11, to close that day in the high $10’s. The next day, it peaked at $11.96 only to fall sharply in the afternoon going red on the day (2). Taking this as a sign of weakness, I entered into a short position, but the stock managed to come back some and close slightly positive at $11. I could see the next morning it wasn’t quite ready to break down, so I covered for a loss (3) avoiding the potential for further losses as the stock ran back up to $11.50.

1) Run-up, 2) Sign of weakness, 3) Not breaking down, 4) Fading, no shares, 5) Fading, found shares, 6) Covered

There was clear fading in the afternoon, and so I tried to re-short (4), but no shares were available through my broker, so I had to just sit on my hands. Monday started low but spiked real fast in the morning. By afternoon, it was clear that both the volume was fading and the price was falling, a great indicator of an upcoming drop (5). Luckily, my broker did have shares this time, so I shorted again, an even larger position since everything was in my favor: stock was red on the day, close to making a new day’s low, fading volume, and coming off of a spike.

Today, I covered my position (6) even though it’s likely the stock had another dollar to drop. My reasons for playing it safe are as follows: First, stormy weather was causing problems with my internet connection, and this was affecting my trading platform. Second, I rarely like holding for more than 2 days. Third, a lot of traders don’t like the risks involved in holding a short position over the weekend, so Friday squeezes are common, and sometimes it even happens on a Thursday. The later in the week I hold, the more probable a price spike becomes. And fourth, given the trading history of BVSN, after 4 red days, a green day is due.

Aside from the price action, what’s worth mentioning is how I traded. I made two trades on this. On one I lost money, on the other I made money. You might be tempted to say that’s 50/50, no better odds than tossing a coin. But on net between these two trades, I’m up about $300 on a $3500ish investment, for a roughly 8.5% gain in less than one week. If only I could do that every week. 8.5% per week, compounded, would mean making 70 times my position (or close to a quarter million dollars) by year’s end!

So 50/50 really isn’t that bad if you can: Spot opportunities, Have a plan, Manage your risks, and Stay disciplined and humble. I believe technical analysis and the Austrian perspective will not only give you a better understanding of the markets in general, but make you better on those four specific points.

Categories: Trading Tags:

Two Weak Companies – Week Two

September 24th, 2012 No comments

Once again, my eyes are on BroadVision Inc (NASDAQ:BVSN) and USEC Inc (NYSE:USU).

USEC Inc continues to behave according to the textbook pattern of a worthless company up on hype. Some might call a $100 million subsidy news. I call it hype because, remember, they lost $92 million last quarter. This puts them on pace to blow through this subsidy in 3 months, making this very temporary news. What could keep the stock price from going right back down to 50 cents in 3 months is the expectation of the possibility of another $100 million subsidy down the road.

Recall I wrote the following on Friday,

Yesterday’s accelerated gains was actually an early warning sign, but often small market cap companies can have 2 or even 3 consecutive days of huge gains before falling apart. However, a red day is a sign of a shift in momentum.

Wednesday the stock closed at 74 cents, Thursday it closed at 84 cents, and Friday it closed at 95 cents. That’s back-to-back days of 13% gains. Today erased Friday’s gains completely. For a while it looked like it was holding support at 85 cents which, you’ll recall from my post Friday, was formerly resistance. But it dropped below that support level towards the market close. Tomorrow I’ll be looking out for a potential morning panic. I want to see if this stock re-tests the 75 cents level, which you might recall was last Wednesday’s high and Thursday’s opening price.

If tomorrow turns out to be a green day, however, this could indicate a consolidation, which is often characterized by choppy or sideways price action. If it does consolidate, this is a potential buy, but a tricky one. 95-96 cents is the current resistance level based on Friday’s high/closing prices. However, $1 is also a key level just because it’s a nice, round figure. There is the possibility that a breakout above 96 cents would fail to break $1, and that doesn’t leave much room to take profits. For this reason, I would only buy if I have reason to believe it will be a strong enough breakout to break both levels. Price action and volume at the moment might convince me, but I’d like to see a long consolidation first.

I currently own Put options on $USU. I’m ready to cut losses or take profits quickly unless I see something in the price action that changes my mind.

USEC Inc closes red after two consecutive 13%+ green days.

BVSN looked like it was going to break down last Thursday, so I shorted it late in the day only for it to up-tick and close green, so I was quick to cover the next morning for a 5% loss. By Friday afternoon, the stock was clearly fading, but shares weren’t available to short. This is what makes a sure-fire pattern tricky. Today, the fading continued, but I was able to find shares and took a position. Going into the close, I had some nice unrealized gains to give me a buffer against a sudden rise in price, but the pattern is ripe for a big drop tomorrow. This is the game I love to play: heads I win, tails I break even.

After a multi-day runup, BVSN has now seen two days of slowly falling stock price and fading volume.

Markets overall were down today, Gold, Silver, Dow, S&P, and oil services. Of my market indicators, only 30-year treasures were up, but nothing was changed by much today. Three out of four stocks follow the overall market, so that everything was down had some influence on these two stocks today. What I would like to see is the Dow and S&P re-test their breakout levels. This would mean going down some more in the near term, and that would help my positions, but that could also set the markets up for a rally, and I don’t imagine gold and silver will be left behind if that happens.

Categories: Uncategorized Tags:

A Plan Can Make You Right, Even When You’re Wrong

September 21st, 2012 No comments

USEC Inc (NYSE:USU) turned out to be a great lesson today. I wrote intra-day about this stock and that I thought we were seeing signs of its momentum shifting, but it ended up making a comeback as the day went on, closing well in the green at 95 cents. Recall what I wrote earlier today,

If it breaks out above 85 cents, or at least proves to me it’s not breaking down any further, I would consider this a potential re-buy,

If you’d bought it the instant it broke out above 85 cents, you were up around 10% in less than 10 minutes. The important take-aways here are that these technical price levels do matter, that the aim is to react not predict, and a good plan can turn a losing prediction into a winning reaction.

USEC Inc goes red-to-green in the final minutes.

Categories: Trading Tags:

Rising Tides Lift More Than Just Boats

September 21st, 2012 No comments

After being up for 6 straight days, USEC Inc (NYSE:USU) has finally had a red day. Yesterday’s accelerated gains was actually an early warning sign, but often small market cap companies can have 2 or even 3 consecutive days of huge gains before falling apart. However, a red day is a sign of a shift in momentum. So far, the downward move has not yet erased Thursday’s big one-day gain, so it is possible the stock is just cooling off to go higher. But at this point, I am looking for the stock price to prove to me it can go higher before I jump in. If I had bought when I first alerted this stock at 54 cents, I would be selling now for a very handsome percent gain. If it breaks out above 85 cents, or at least proves to me it’s not breaking down any further, I would consider this a potential re-buy, but I have no interest in trying to guess the bottom to buy on the cheap.

Remember, Austrian economics teaches us we cannot know what future demand will be, and shares in a stock have a supply and demand just like any good traded on any market. We cannot predict, we can only prepare for likely scenarios and be ready to react.

Listeners of the Peter Schiff show may recall months ago when he warned of Jonathan Lebed and the National Inflation Association’s pump and dump scheme of BroadVision Inc (NASDAQ:BVSN). The NIA have long since stopped pumping this stock, and it’s been in free-fall ever since, but every now and then it has a big, multi-day run-up, and these run-ups provide technical opportunities for short-sellers.

There are two reasons why it is a good idea to consider short-selling BVSN. First, as most Austrians can probably appreciate, is the stock price is ultimately destined for de-valuation. Short-selling BVSN is making a trade in the directions of fundamentals, which will reward you in the long-term. The second reason is because BVSN is experiencing a technical event.

Unlike other aspects of technical analysis, which require a degree of subjectivity in guessing what key price levels are, technical events are more objectively grounded. The technical event we have here is a short-squeeze. A short-squeeze is basically when short-sellers are looking to close their positions, they must buy to cover. This buying, however, represents the closing of positions and is in no way indicative of speculators seeing future strength in the stock. The squeeze happens when the market somehow coordinates short-sellers into covering all around the same time. The sudden surge of buyers in a stock, especially a stock that is volatile, has a low float, and/or is trading in low volume, can send the price skyrocketing.

Regression to the mean is almost a gift from the market to short-sellers. However, sometimes the price surge can get the attention of real buyers and create some upward momentum. Sometimes this catches short-sellers off guard, and they have to cover and even higher prices still just to avoid being wiped out, so this move is not without its risks. In an ideal world, the safest way to play this is to wait for the first red day. The problem is in order to short sell, your broker needs to find you shares of the stock to borrow, and once momentum has shifted to the downside, those shares quickly become unavailable.

BVSN looked like it was finally ready to break down yesterday, so I entered a short position, mostly hoping for an early morning panic this morning. That didn’t happen, so I made sure to get out right away. Short-sellers generally don’t like holding over the weekend because there’s too much risk of positive news coming out during that time. This is the sort of thing that can coordinate covering and send the price higher. However, anyone who was going to cover before the close will be covered before the close, so if this stock spikes big at the end of the day, that spike may be the ideal time to short. It’s always nice holding an unrealized profit in a trade while awaiting the big move.

Categories: Markets, Trading Tags:

Was Peter Schiff Right?

September 19th, 2012 No comments

There’s no need to rehash the details already captured beautifully in the viral “Peter Schiff Was Right” YouTube videos. The verdict on that is clear. Peter Schiff nailed 2008. But how has he done since? Critics point out that we haven’t had the inflation he predicted, and US bond prices have not only not crashed but actually made new all-time highs. Is Peter Schiff still right?

It’s important to clarify that when Peter Schiff talked about inflation, he was using the Austrian definition of inflation, which is monetary expansion. Is this a cop out or some sneaky way of dodging the facts as they have actually played out? Absolutely not, and I can prove it. If one believed that the official inflation figure, the CPI, is what would rise, one could play that by investing in TIPS–Treasury Inflation Protected Securities. But rather than advise his readers to invest in TIPS, Peter Schiff in Chapter 8 of CrashProof warns against them, writing “However, buying TIPS is a perfect example of trusting the fox to guard your henhouse. The basic problem with TIPS is that they are indexed to the consumer price index (CPI), which does not reflect actual inflation, but rather the government’s highly understated version of it.”

So what did Peter recommend? The title of Chapter 9 of his book holds a hint, “Gold Rush–Be the First Person o Your Block to Stake a Claim.” Even if you measure gold in the most unfavorable way possible, from its peak price before the ’08 crash to the recent lows we’ve just come out of 4 years later, you see more than a 50% increase, which yields an average annualized growth rate of around 10%. Fairer measures would be to look at peak-to-peak or trough-to-trough gains which show annualized growth of 20%. And, finally, if you were an ace trader who nailed the bottom and top, and held the entire time in between, your annualized growth rate would be north of 30%. I think those price increases qualify as high.

As to bond prices, it is true that Peter predicted they would fall, but specifically he predicted a bubble in the bond market. The fact that bond prices have risen to new highs actually supports, not damns Peter’s case. The fact that his critics misrepresent Peter on this point is so inexcusable that it doesn’t warrant my effort of citing a written source. The bond bubble is mentioned, plain as day, in radio ad for his brokerage firm. It doesn’t exactly require a lot of digging.

But debunking the critics isn’t enough for me. I would like to really go out on a limb and take this one step further and say I believe Peter Schiff was more right than even Peter Schiff gives himself credit for. Peter Schiff admits the one thing he got wrong was that he didn’t foresee the world flooding into the dollar as a result of the ’08 panic. My defense of Peter on this is that his niche is in building conservative portfolios for weathering economic crisis.

Recall last week when I wrote about USEC Inc (NYSE:USU), talking about how it was a terrible company, but that nonetheless I thought its price would rise. As of this writing, USEC’s stock price is up 37% in less than a week. Because this company is so fundamentally weak, it is not a conservative investment vehicle. If we measured the performance of the S&P, the Dow, Gold, Silver, Oil, and so in, in terms of the number of shares in USEC it could buy, this past week would look like a bloodbath. Does that mean in retrospect everyone should have sold everything to buy USEC shares? Not if you’re a conservative investor.

So I draw an analogy between USU and the USD. Yes, in hindsight, if we were wily speculators, the dollar was the place to be in late ’08. Since we measure prices in dollars, it looks like people who followed Peter’s advice and bought at the peak got killed, but a conservative investment advisor like Peter Schiff would have been wrong to recommend being in dollars. The performance of Peter Schiff’s strategy during any other time and the speed with which a Shiff portfolio bounced back is further evidence supporting my case.

Categories: Uncategorized Tags:

Is Austrian Economics Scientific?

September 19th, 2012 No comments

There are plenty of Austrians who will make the case from A to Z about how Austrian Economics is scientific. I do not need to repeat their efforts, so I will not be making the case that Austrian Economics is deduced from a true axiom. Rather I’ll take a softer view, but one that is harder to refute. Rather than claim statements deduced from the action axiom, humans act, are a priori truths, I will simply point out that they are conditional truths. That is, they are true whenever the statement “humans act” is true.

But when non-Austrians study history or economics or any of the other areas Austrians use praxeology to study, they are never denying humans acting. Sure, they may not feature human action as the center of their models, they may aggregate humans into groups to solve more easily solve larger problems, but they aren’t denying fundamentally that human act.

The testing of hypothesis via the scientific method also implies another truth that non-Austrians accept: the demand for internal consistency. If a new data point is inconsistent with the story the hypothesis tells, the data point may be an indicator that the hypothesis is flawed, or perhaps the hypothesis indicates that the observation of the data point is somehow flawed, but something must give. Science does not abide logical inconsistency.

So when studying economics from any school’s perspective, we are implying humans act, and so all theories must be consistent with all propositions deduced from the fact that humans act. Any inconsistency tells us one of two things–either the non-Austrian theory is wrong, or humans aren’t acting. Since non-Austrian economics implicitly assume humans do act, whether the Austrians are right or wrong, whether Austrian economics is science or not, the non-Austrian hypothesis in question is certainly flawed.

From this soft position, then, I cannot truly argue that Austrian Economics is scientific, only that it is more scientific than any competing school of economics. When pressed, defenders of mainstream science ultimately become more humble, acknowledging we can never know any scientific proposition is true with 100% certainty, and that the current state of science merely represents the best we can do at this time. As per my above reasons, for now it’s the Austrian School that provides us the best economic science we have.

Categories: Academic, General Tags:

What’s Another $100 Million?

September 13th, 2012 No comments

Yesterday I was alerted to a libertynews.com story regarding the house approval of another $100 million in taxpayer dollars for USEC Inc. (NYSE:USU). This was a stock I traded back in February of this year, buying Put options and banking when it went from $1.93 on Feb 1 down to $1.28 on Feb 10. It closed yesterday at 50 cents per share, today at 54 cents. This makes the current market cap of the company about $65 million, not even two-thirds of the amount of money it’s being given.

What’s worth noting is that the price-to-book ratio on this company is .09, which means its worth $65 million despite having over $700 million in net tangible assets. Taken at face value, USEC is worth more if it goes under than if it continues its operations. But I would have to question, if this is true, why doesn’t Mitt Romney just come along, offer to buy all outstanding shares at triple current market price thereby taking over the company, close the doors, and sell it off for a cool $500 million profit on a $200 million investment?

I’ll be honest. I don’t know the first thing about this company. I don’t know exactly what their plant looks like, what it could re-sell for, what constitutes its inventory, et cetera. What I do know is price action. Its chart is that of a dying company, and its price-to-book ratio tells me the company has been very generous in the valuation of its own assets. It’s not worth anything in-business, and it’s not worth anything out-of-business.

Maybe news of their cash infusion will cause nice multi-day spike in its stock price creating a shorting opportunity. But I warn time and time again, there’s no limit to how high the price of worthless paper can go. Now is not the time to jump the gun on shorting this stock, but this is definitely one to watch. Something to consider is the fact that USEC received a de-listing warning from the New York Stock Exchange back in April when its stock price fell under $1, so there’s likely to be a push to get it back up over $1. It could go to $5 and still maintain a market cap below its book value. I think it’s unlikely to break $1 because there are so many bag-holders, including Vanguard whose position in USEC near as I can tell dropped in value from around $13 million to about $7 million in the past 3 months.

Categories: General Tags:

Markets at Key Levels

September 11th, 2012 No comments

When looking at the macro-economy, I keep 6 charts up on my screen: Silver, Gold, S&P, Dow, 30-Year Treasuries, and Oil Services Index. Based on these charts, I evaluate the state of the market applying the same technical analysis I use for individual stocks. The latter two, bonds and oil, I use mainly as context. Its the former 4 that really clue me in to what to expect in the near-term. Normally, I expect gold and silver to behave similarly to one another, as do I expect the Dow and the S&P to behave similarly. As the price of any of the above approaches a technical price level, I then look to see if its counterpart is approaching a corresponding technical level.

Two weeks ago, I noted that gold and silver were both breaking trend-line resistance, making for a high probability breakout. Last Thursday, the S&P broke out to a new multi-year high, but the Dow is still trading below that key price level. And, indeed, trading the S&P intra-day or even overnight proved to be profitable, however it will be a far better play if and when the Dow also breaks out to a new multi-year high. It is worth watching both closely in the coming days and weeks to see what happens. If the Dow fails to breakout, that’s a likely indicator that the S&P’s breakout was actually a fake-out/breakout, but if the Dow does breakout, that’s a likely indicator that both the Dow and the S&P will move higher.

It’s a good bet that a lot of this will depend on news coming out of the Federal Reserve. Many Austrian forecasters go beyond simply analyzing economics and try to forecast what the Federal Reserve will do. No matter how often these forecasters are correct, it’s important to react to the price action rather than predict the news. It may very well be that the markets have come to the same conclusions as Austrian forecasters, and the news may be priced in. It’s even possible that markets over-estimated bullish news so that even if the news is positive for stock prices, the Dow and S&P can still fall if the news isn’t positive enough.

Meanwhile, gold and silver look to be approaching another key level. It would be nice if they have big gains tomorrow to get them at that level going into the FOMC. It’s less desirable to trade gold and silver if it’s mid-range. It’s less clear side of the trade you want to be on, and the moves to the next key level are only half the size. Oil services also appears to be at a key technical level and 30-year Treasuries looks to be trading sideways within a relatively narrow range consistent with a consolidation.

Categories: Uncategorized Tags:

Trading Basics, Part I – Support & Resistance

September 4th, 2012 No comments

Critics of technical analysis is sometimes liken it to reading tea leaves, perhaps because it is partly subjective. There are a lot of different tools, but most traders pick and choose only a few to use. But the same could be said about running a business, and yet we can clearly see some individuals have consistently better track records than others for being profitable. The analogy is especially appropriate because successful traders tend to view trading as a business.

The most basic technical indicators are support and resistance levels. Support are relatively low price levels the stock has trouble falling below, and resistance is the relatively high price level the stock has trouble climbing above. If a stock is “range-bound”, trading within a tight price range, the high end of that range is the resistance and the low end is support. Other key price levels are where spikes or dips occur. It’s rare that these key levels are hit precisely, down to the penny, so some eye-balling is required, and some practice is required to select the most effective levels. The best price levels tend to be at round numbers.

Notice how often and spikes and dips turn around close to multiples of 1000 points.


When a stock price breaks out above a key resistance level, resistance often becomes support. And likewise when support is broken, it becomes resistance for the stock price thereafter. Moreover, when a stock price breaks through a support or resistance level, the stock price usually continues in that direction and changes at a faster rate. These technical moves provide an opportunity for traders to make quick profits.

From an Austrian perspective, there are real human action reasons why it works this way. The most common reason articulated is that of the “bag-holder”. This is someone who bought the stock at a higher price and held onto it despite it having gone down. When the stock moves to the top of its trading range, the bag-holder sees an opportunity to finally get out at a decent price. Another common reason has to do with belief. Traders may not believe the stock likely to break out above resistance, so when the price gets there, they take a short-position, betting on the stock price dropping. Speculators may also be trading within the range, buying at the low of the range and selling at the high.

For these various reasons, as the price reaches the resistance level, it brings in a disproportionate number of sellers, which of course will tend to push the price back down. However, if enough buyers take interest in a potential breakout, there are buyers for all the sellers. Once all the sellers have sold, the buyers push the stock price into a zone where there are relatively few sellers, and this allows the stock price to rise very quickly. This works for individual stocks as well as the overall market and creates difficulty for mathematical economic and financial models because breakouts stack the odds to make outliers more common than stochastic movements can account for.


Categories: Trading Tags: , , ,