Archive

Author Archive

What’s Another $100 Million?

September 13th, 2012 No comments

Yesterday I was alerted to a libertynews.com story regarding the house approval of another $100 million in taxpayer dollars for USEC Inc. (NYSE:USU). This was a stock I traded back in February of this year, buying Put options and banking when it went from $1.93 on Feb 1 down to $1.28 on Feb 10. It closed yesterday at 50 cents per share, today at 54 cents. This makes the current market cap of the company about $65 million, not even two-thirds of the amount of money it’s being given.

What’s worth noting is that the price-to-book ratio on this company is .09, which means its worth $65 million despite having over $700 million in net tangible assets. Taken at face value, USEC is worth more if it goes under than if it continues its operations. But I would have to question, if this is true, why doesn’t Mitt Romney just come along, offer to buy all outstanding shares at triple current market price thereby taking over the company, close the doors, and sell it off for a cool $500 million profit on a $200 million investment?

I’ll be honest. I don’t know the first thing about this company. I don’t know exactly what their plant looks like, what it could re-sell for, what constitutes its inventory, et cetera. What I do know is price action. Its chart is that of a dying company, and its price-to-book ratio tells me the company has been very generous in the valuation of its own assets. It’s not worth anything in-business, and it’s not worth anything out-of-business.

Maybe news of their cash infusion will cause nice multi-day spike in its stock price creating a shorting opportunity. But I warn time and time again, there’s no limit to how high the price of worthless paper can go. Now is not the time to jump the gun on shorting this stock, but this is definitely one to watch. Something to consider is the fact that USEC received a de-listing warning from the New York Stock Exchange back in April when its stock price fell under $1, so there’s likely to be a push to get it back up over $1. It could go to $5 and still maintain a market cap below its book value. I think it’s unlikely to break $1 because there are so many bag-holders, including Vanguard whose position in USEC near as I can tell dropped in value from around $13 million to about $7 million in the past 3 months.
Categories: General Tags:

Markets at Key Levels

September 11th, 2012 No comments

When looking at the macro-economy, I keep 6 charts up on my screen: Silver, Gold, S&P, Dow, 30-Year Treasuries, and Oil Services Index. Based on these charts, I evaluate the state of the market applying the same technical analysis I use for individual stocks. The latter two, bonds and oil, I use mainly as context. Its the former 4 that really clue me in to what to expect in the near-term. Normally, I expect gold and silver to behave similarly to one another, as do I expect the Dow and the S&P to behave similarly. As the price of any of the above approaches a technical price level, I then look to see if its counterpart is approaching a corresponding technical level.

Two weeks ago, I noted that gold and silver were both breaking trend-line resistance, making for a high probability breakout. Last Thursday, the S&P broke out to a new multi-year high, but the Dow is still trading below that key price level. And, indeed, trading the S&P intra-day or even overnight proved to be profitable, however it will be a far better play if and when the Dow also breaks out to a new multi-year high. It is worth watching both closely in the coming days and weeks to see what happens. If the Dow fails to breakout, that’s a likely indicator that the S&P’s breakout was actually a fake-out/breakout, but if the Dow does breakout, that’s a likely indicator that both the Dow and the S&P will move higher.

It’s a good bet that a lot of this will depend on news coming out of the Federal Reserve. Many Austrian forecasters go beyond simply analyzing economics and try to forecast what the Federal Reserve will do. No matter how often these forecasters are correct, it’s important to react to the price action rather than predict the news. It may very well be that the markets have come to the same conclusions as Austrian forecasters, and the news may be priced in. It’s even possible that markets over-estimated bullish news so that even if the news is positive for stock prices, the Dow and S&P can still fall if the news isn’t positive enough.

Meanwhile, gold and silver look to be approaching another key level. It would be nice if they have big gains tomorrow to get them at that level going into the FOMC. It’s less desirable to trade gold and silver if it’s mid-range. It’s less clear side of the trade you want to be on, and the moves to the next key level are only half the size. Oil services also appears to be at a key technical level and 30-year Treasuries looks to be trading sideways within a relatively narrow range consistent with a consolidation.

Categories: Uncategorized Tags:

Trading Basics, Part I – Support & Resistance

September 4th, 2012 No comments

Critics of technical analysis is sometimes liken it to reading tea leaves, perhaps because it is partly subjective. There are a lot of different tools, but most traders pick and choose only a few to use. But the same could be said about running a business, and yet we can clearly see some individuals have consistently better track records than others for being profitable. The analogy is especially appropriate because successful traders tend to view trading as a business.

The most basic technical indicators are support and resistance levels. Support are relatively low price levels the stock has trouble falling below, and resistance is the relatively high price level the stock has trouble climbing above. If a stock is “range-bound”, trading within a tight price range, the high end of that range is the resistance and the low end is support. Other key price levels are where spikes or dips occur. It’s rare that these key levels are hit precisely, down to the penny, so some eye-balling is required, and some practice is required to select the most effective levels. The best price levels tend to be at round numbers.

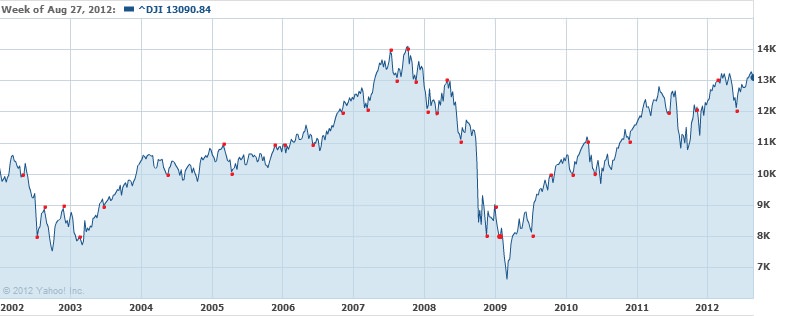
Notice how often and spikes and dips turn around close to multiples of 1000 points.


When a stock price breaks out above a key resistance level, resistance often becomes support. And likewise when support is broken, it becomes resistance for the stock price thereafter. Moreover, when a stock price breaks through a support or resistance level, the stock price usually continues in that direction and changes at a faster rate. These technical moves provide an opportunity for traders to make quick profits.

From an Austrian perspective, there are real human action reasons why it works this way. The most common reason articulated is that of the “bag-holder”. This is someone who bought the stock at a higher price and held onto it despite it having gone down. When the stock moves to the top of its trading range, the bag-holder sees an opportunity to finally get out at a decent price. Another common reason has to do with belief. Traders may not believe the stock likely to break out above resistance, so when the price gets there, they take a short-position, betting on the stock price dropping. Speculators may also be trading within the range, buying at the low of the range and selling at the high.

For these various reasons, as the price reaches the resistance level, it brings in a disproportionate number of sellers, which of course will tend to push the price back down. However, if enough buyers take interest in a potential breakout, there are buyers for all the sellers. Once all the sellers have sold, the buyers push the stock price into a zone where there are relatively few sellers, and this allows the stock price to rise very quickly. This works for individual stocks as well as the overall market and creates difficulty for mathematical economic and financial models because breakouts stack the odds to make outliers more common than stochastic movements can account for.


Categories: Trading Tags: , , ,

What’s Going on with Gold?

September 1st, 2012 No comments

When it comes to saving up a store of value, Austrians love gold. But the past year has been less than kind to the precious metals as gold fell just over 20% from its highs before rebounding some and silver fell nearly 50% from its highs before finding a bottom. Are the Austrians wrong? Is the run in precious metals over?

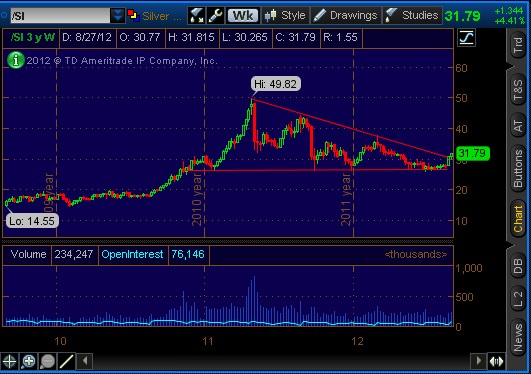
A look at the weekly charts in gold and silver show a couple of very sharp drops in each, followed by bounces, with each bounce failing to make a new high. These are bearish signs. However, after the second sharp drop in silver, silver hasn’t made a new 52-week low, either. In fact, gold and silver look to be holding support really well, and if one were to draw a trend line at each of the peaks (where the prices meet resistance), one can see that just this week that prices broke out above the trend. All signs now point to strength.

Gold holds price support during down-trend. This week, Gold breaks out above trendline resistance.

Silver holds support during downward trend. This week, breakout above trendline resistance.

I attribute the breakout this week to markets anticipating good news for the metals coming out of the FOMC this weekend. But whenever the markets are anticipating something, I get skeptical. I begin asking myself, “Okay, but what if that doesn’t happen?” In that case, silver probably would have gone back down to the 26.50-28.50 range it had been trading in the past few months, and gold would have gone back down to the 1550-1650 range. After what happened with Ron Paul at the RNC this week, I wouldn’t put it past the markets to kick me while I’m down.

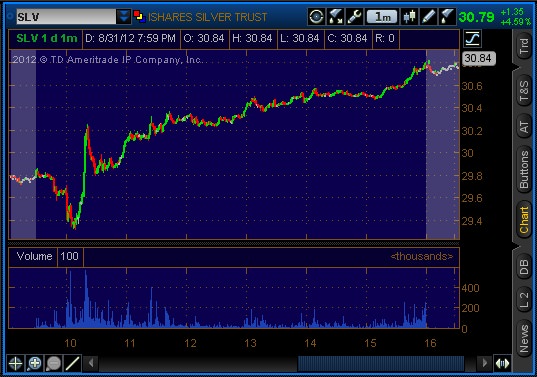
In early morning trading Friday, it looked like that’s exactly what was goin to happen. I even placed a trade betting on the price of silver dropping, and profitably exited the trade once the price had fallen to a key technical level. But rather than continuing to drop, the price bounced, ultimately spiking to the week’s high. It broke through that high in the afternoon, at which point I entered in a new trade, this time betting on the price to rise further. Sure enough, it trended up the remainder of the day, ending in a spike in the last half hour before the closing bell.

Bought Puts at 9:48 AM, sold them at 10:03 AM. Bought $USLV afternoon breakout at 12:59 PM.

So I went from betting on the price to go down in the short-term to betting on it going up all in one day. The past couple of weeks have been good to gold and silver, so much so that I was anticipating a major retrace Friday. Since that did not happen, these charts are looking very strong to me. A retrace in the near term is still very likely, but it will be a lot more mild than the one I was looking for Friday.

Categories: General Tags: , ,

A Brief Introduction to the Austrian Case for Technical Analysis

August 30th, 2012 No comments

Economists of the Austrian school know that economics is a deductive and qualitative science. This means economic theories build on one another logically rather than being discovered through experiment, and that economics can only indicate whether we can expect more or less of something rather than the exact amount. Investing according to fundamental analysis seems a more natural fit to an Austrian Economist than speculating according to technical analysis, which relies on looking at historical data. But my goal here is to make the Austrian case for technical analysis.

Austrian economists know that the price system coordinates economic activity. If some event causes a good to be in short supply, this causes the price to rise, and so people who consume the good will want to consume less while those who produce the good will want to produce more. Producers and consumers do not necessarily need to know why the price has changed–the simple fact that it has changed is sufficient to coordinate their behaviors. Faced with the complexity of a modern economy where it is impossible to know all the relevant factors, price is vital to coordination.

The same is true of stocks. At any given time, any number of fundamental factors are in play, but the stock is traded at a price, and that price is sufficient to coordinate buying and selling. Furthermore, although technical patterns are often referred to as being “psychological”, time-and-sales data represents not states of mind but rather actual instances of human action. So the task is to explain the past data and react to indicators, and it is from this perspective that I will examine chart patterns.

Categories: General Tags:

Hello world!

August 29th, 2012 1 comment

Welcome to Free Capitalist Network. This is your first post. Edit or delete it, then start blogging!

Categories: Uncategorized Tags: